5. Privilege Analytics
Objective
Analyze and monitor privilege usage to detect security risks, excessive permissions, and abnormal patterns through CloudTrail logs.
Step 1: Verify CloudTrail Data
1.1 Check CloudTrail Logs
- Open Amazon CloudTrail in the console
- Verify that trail IdentityGovernanceTrail was created in chapter 2
- Check S3 bucket containing CloudTrail logs
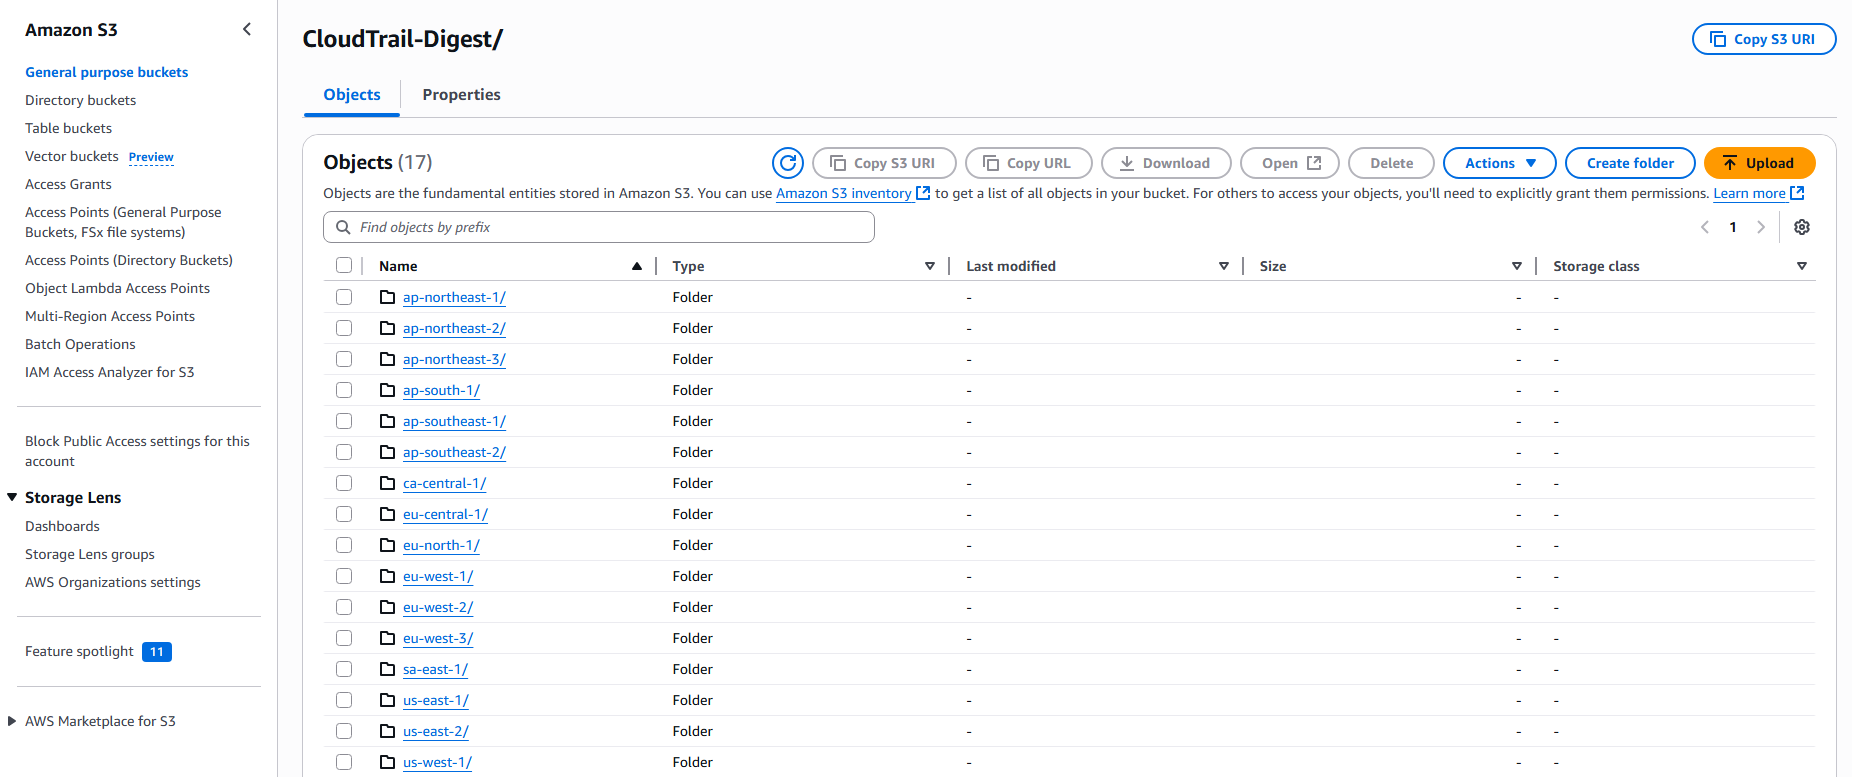
1.2 Verify S3 Bucket has CloudTrail Data
- Go to Amazon S3 console
- Find CloudTrail bucket (name like
aws-cloudtrail-logs-xxx) - Verify that log files are being created
Step 2: Create Lambda Function for Privilege Analytics
2.1 Create Lambda Function
- Open AWS Lambda in the console
- Click Create function
- Choose Author from scratch
- Enter function details:
- Function name:
PrivilegeAnalyticsEngine - Runtime: Python 3.9
- Architecture: x86_64
- Function name:
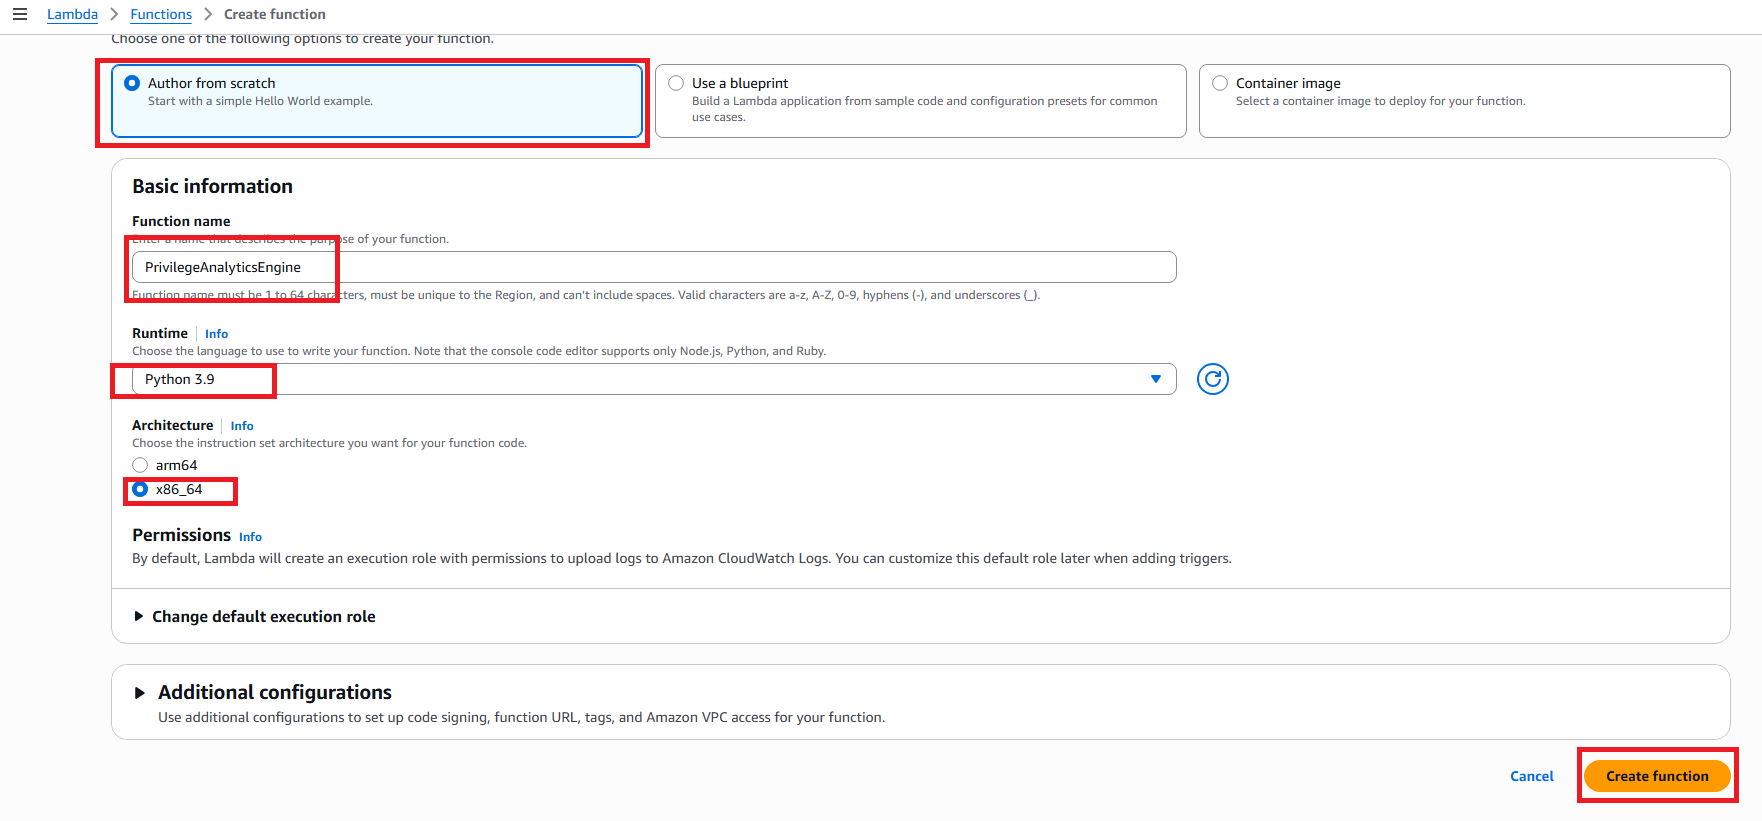
- Click Create function
2.2 Configure Lambda Function Code
- In the Code tab, replace the default code with the following:
import json
import boto3
import gzip
from datetime import datetime, timedelta
from urllib.parse import unquote_plus

def lambda_handler(event, context):
    print("Privilege Analytics Engine Started")

    # Initialize AWS clients
    s3 = boto3.client('s3')
    dynamodb = boto3.resource('dynamodb')

    # Get the object from the event
    bucket = event['Records'][0]['s3']['bucket']['name']
    key = unquote_plus(event['Records'][0]['s3']['object']['key'])

    try:
        # Download and decompress CloudTrail log
        response = s3.get_object(Bucket=bucket, Key=key)

        if key.endswith('.gz'):
            content = gzip.decompress(response['Body'].read())
        else:
            content = response['Body'].read()

        # Parse CloudTrail log
        log_data = json.loads(content.decode('utf-8'))

        # Analyze privilege usage
        privilege_events = analyze_privilege_events(log_data['Records'])

        # Store analysis results
        store_analysis_results(privilege_events, dynamodb)

        return {
            'statusCode': 200,
            'body': json.dumps(f'Processed {len(privilege_events)} privilege events')
        }

    except Exception as e:
        print(f'Error processing {key}: {str(e)}')
        return {
            'statusCode': 500,
            'body': json.dumps(f'Error: {str(e)}')
        }

def analyze_privilege_events(records):
    """Analyze CloudTrail records for privilege usage patterns"""
    privilege_events = []

    high_privilege_actions = [
        'CreateUser', 'DeleteUser', 'AttachUserPolicy', 'DetachUserPolicy',
        'CreateRole', 'DeleteRole', 'AttachRolePolicy', 'DetachRolePolicy',
        'PutUserPolicy', 'DeleteUserPolicy', 'PutRolePolicy', 'DeleteRolePolicy'
    ]

    for record in records:
        event_name = record.get('eventName', '')

        if event_name in high_privilege_actions:
            privilege_event = {
                'eventTime': record.get('eventTime'),
                'eventName': event_name,
                'userIdentity': record.get('userIdentity', {}),
                'sourceIPAddress': record.get('sourceIPAddress'),
                'userAgent': record.get('userAgent'),
                'awsRegion': record.get('awsRegion'),
                'riskScore': calculate_risk_score(record)
            }
            privilege_events.append(privilege_event)

    return privilege_events

def calculate_risk_score(record):
    """Calculate risk score for privilege event (1-10 scale)"""
    base_score = 5

    # High-risk actions
    high_risk_actions = ['DeleteUser', 'DeleteRole', 'DetachUserPolicy']
    if record.get('eventName') in high_risk_actions:
        base_score += 3

    # External IP access
    source_ip = record.get('sourceIPAddress', '')
    if not source_ip.startswith('10.') and not source_ip.startswith('172.') and not source_ip.startswith('192.168.'):
        base_score += 2

    # Console vs API access
    user_agent = record.get('userAgent', '')
    if 'console' not in user_agent.lower():
        base_score += 1

    return min(base_score, 10)

def store_analysis_results(privilege_events, dynamodb):
    """Store analysis results in DynamoDB"""
    table = dynamodb.Table('RiskAssessments')

    for event in privilege_events:
        table.put_item(
            Item={
                'AssessmentId': f"privilege-{datetime.now().isoformat()}",
                'EventTime': event['eventTime'],
                'EventName': event['eventName'],
                'UserIdentity': json.dumps(event['userIdentity']),
                'SourceIP': event['sourceIPAddress'],
                'RiskScore': event['riskScore'],
                'AssessmentType': 'Privilege Analysis'
            }
        )
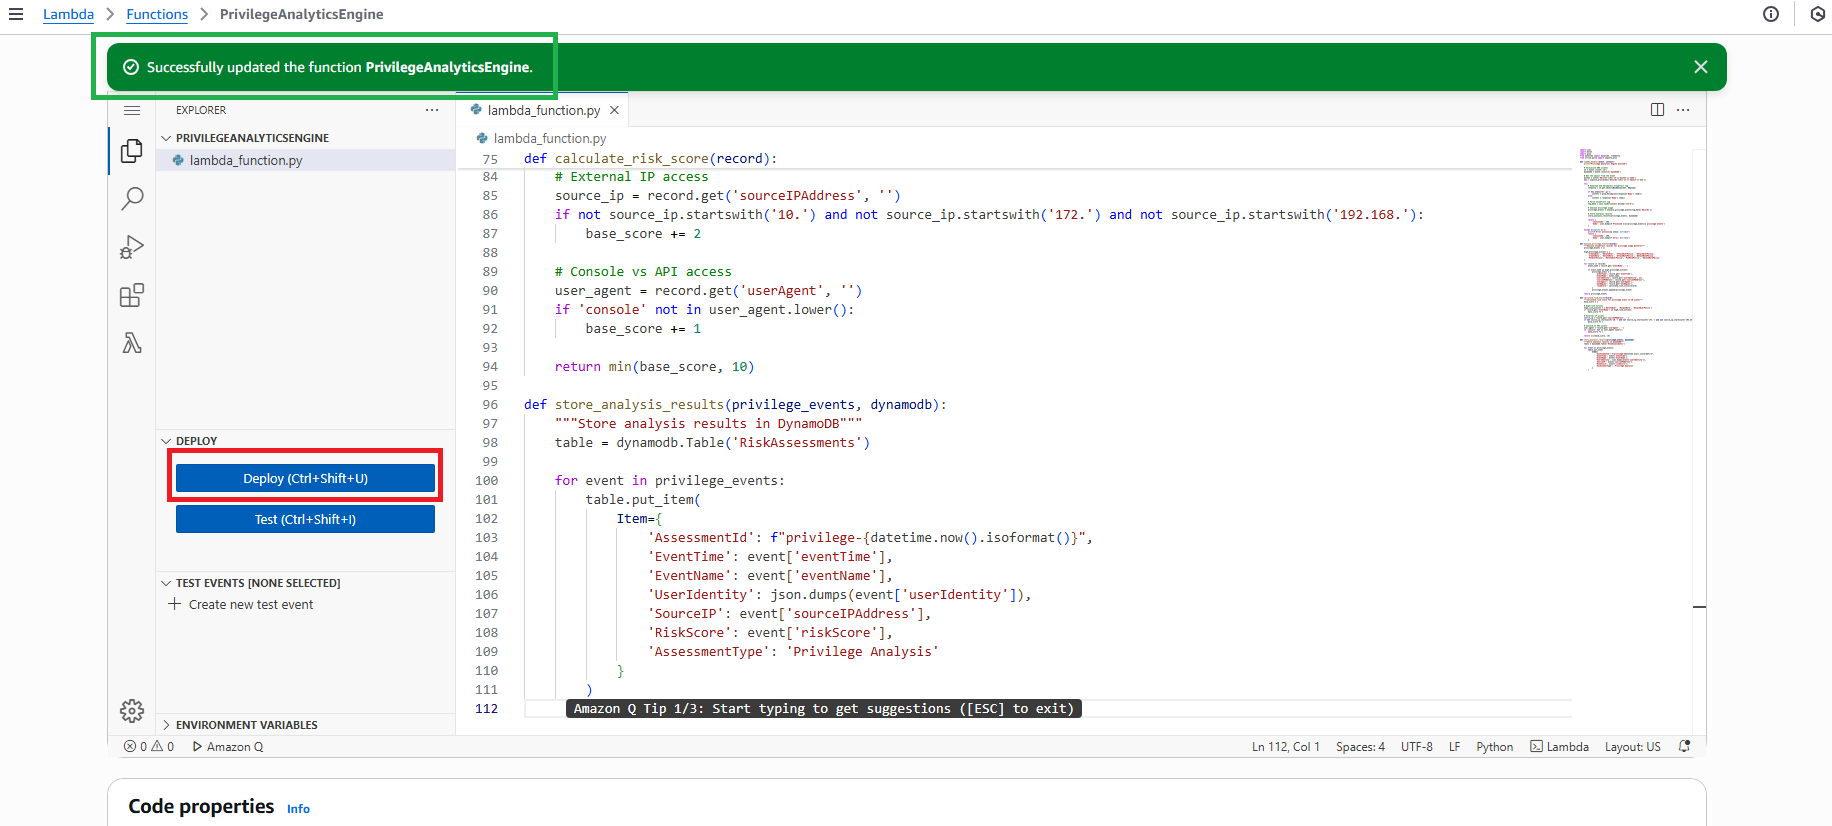
- Click Deploy to save changes
2.3 Configure IAM Role for Lambda
- Go to Configuration tab
- Click Permissions
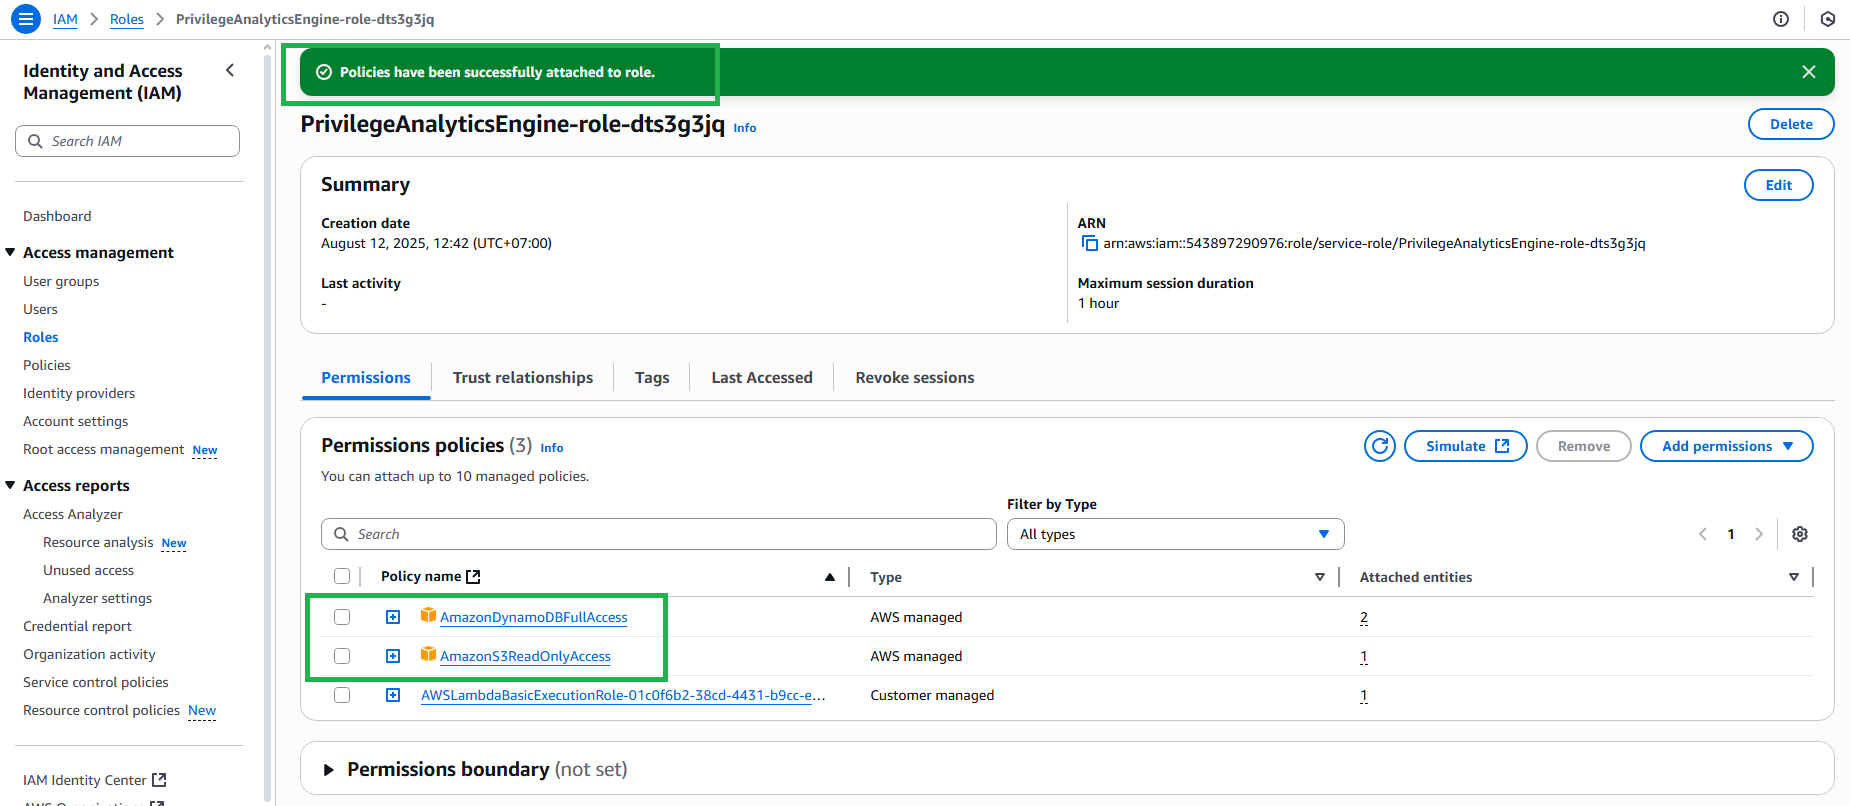
- Click on the role name to open IAM console
- Click Add permissions → Attach policies
- Search and attach the following policies:
- AmazonS3ReadOnlyAccess
- AmazonDynamoDBFullAccess
- Click Add permissions
Step 3: Setup S3 Event Trigger
3.1 Configure S3 Trigger for Lambda
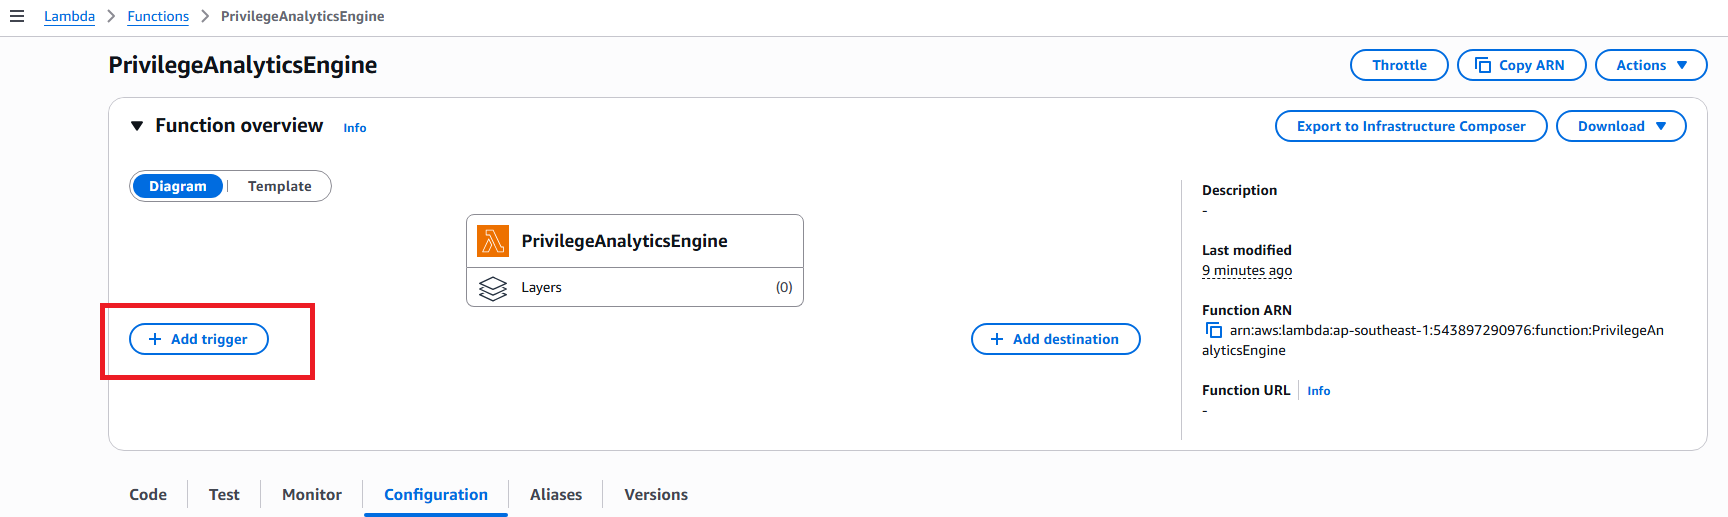
- In Lambda function PrivilegeAnalyticsEngine
- Click Add trigger
- Select S3 from dropdown
- Configure trigger:
- Bucket: Select CloudTrail S3 bucket
- Event type: All object create events
- Prefix:
AWSLogs/(optional) - Suffix:
.json.gz
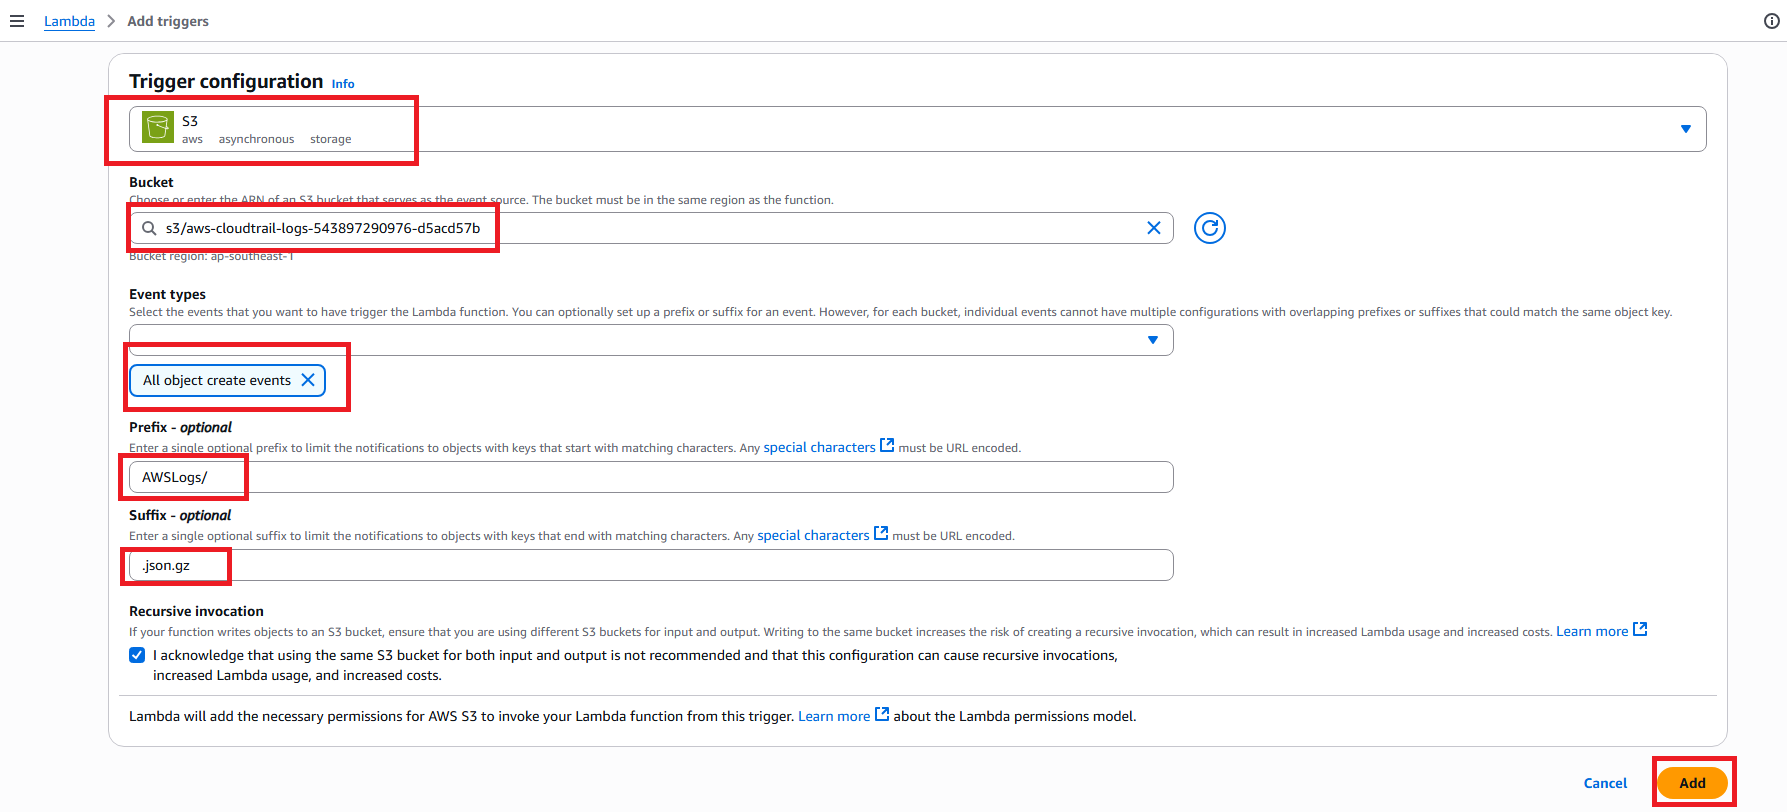
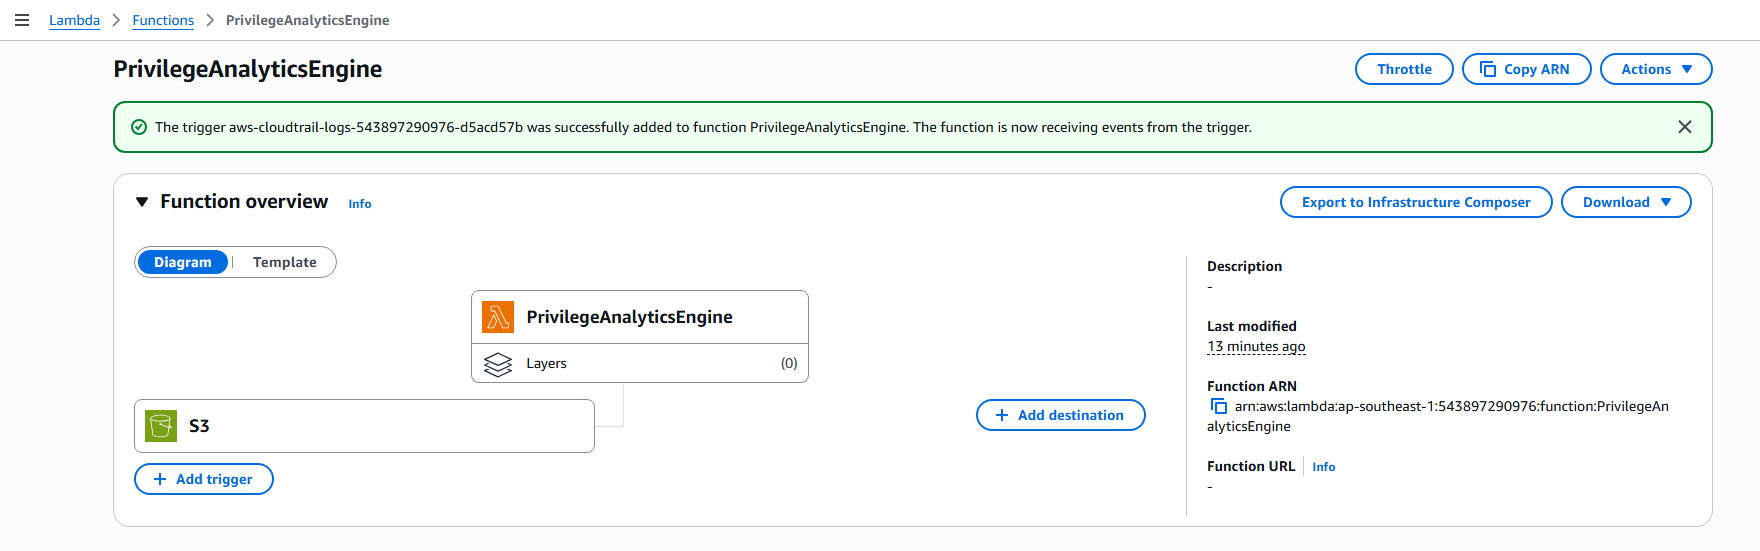
- Click Add
Step 4: Create CloudWatch Dashboard
4.1 Create Dashboard for Privilege Analytics
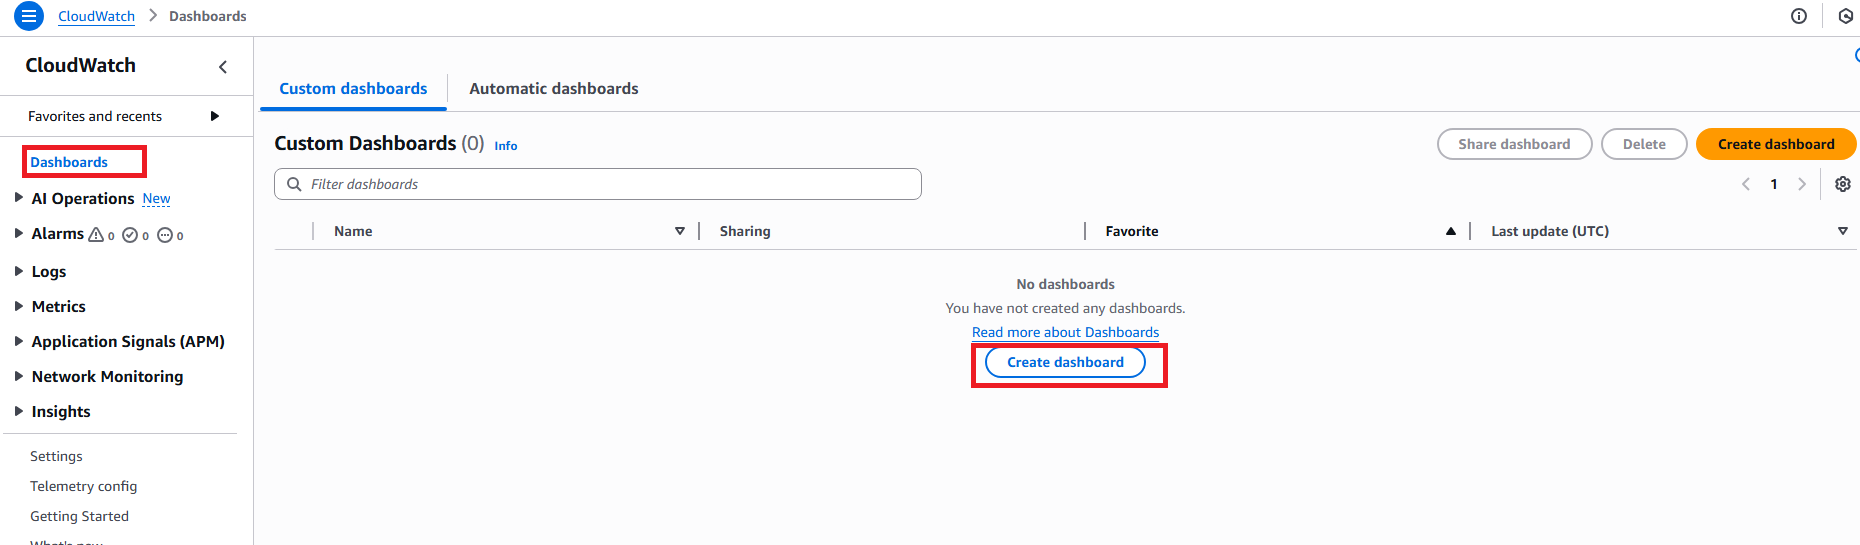
- Open Amazon CloudWatch console
- Click Dashboards in the sidebar
- Click Create dashboard
- Enter dashboard name:
PrivilegeAnalyticsDashboard - Click Create dashboard
4.2 Add Widget 1: Lambda Invocations
- Click Add widget
- Select Line chart
- Click Next
- Configure metric:
- Namespace: AWS/Lambda
- Metric name: Invocations
- Dimensions: FunctionName = PrivilegeAnalyticsEngine
- Click Select metric
- Set widget name: “Lambda Invocations”
- Click Create widget
4.3 Add Widget 2: Lambda Errors
- Click Add widget (in dashboard)
- Select Line chart → Next
- Configure metric:
- Namespace: AWS/Lambda
- Metric name: Errors
- Dimensions: FunctionName = PrivilegeAnalyticsEngine
- Click Select metric
- Set widget name: “Lambda Errors”
- Click Create widget
4.4 Add Widget 3: Lambda Duration
- Click Add widget
- Select Line chart → Next
- Configure metric:
- Namespace: AWS/Lambda
- Metric name: Duration
- Dimensions: FunctionName = PrivilegeAnalyticsEngine
- Click Select metric
- Set widget name: “Lambda Duration (ms)”
- Click Create widget
4.5 Add Widget 4: DynamoDB Write Activity
- Click Add widget
- Select Line chart → Next
- Configure metric:
- Namespace: AWS/DynamoDB
- Metric name: ConsumedWriteCapacityUnits
- Dimensions: TableName = RiskAssessments
- Click Select metric
- Set widget name: “DynamoDB Write Activity”
- Click Create widget
Note: This metric shows write activity to DynamoDB, indicating when new risk assessments are stored.
4.6 Save Dashboard
- Click Save dashboard in the top right corner
- Dashboard will display 4 widgets monitoring:
- Number of Lambda invocations
- Lambda errors
- Lambda execution time
- Number of items in DynamoDB
Step 5: Test Privilege Analytics
5.1 Create Test User to Generate CloudTrail Events
- Go to IAM console
- Click Users in the left sidebar
- Click Create user
- Enter User name:
test-privilege-user - Click Next
- Select Attach policies directly
- Search and select ReadOnlyAccess
- Click Next → Create user
5.2 Perform High-Privilege Actions
- In IAM console, select the test-privilege-user you just created
- Click Permissions tab
- Click Add permissions → Attach policies directly
- Search and attach PowerUserAccess policy
- Click Add permissions
- Then Remove the PowerUserAccess policy to create more events
- Create test role:
- Click Roles in sidebar
- Click Create role
- Select AWS service → Lambda
- Click Next → Next
- Role name:
test-privilege-role - Click Create role
5.3 Wait for CloudTrail Processing
- CloudTrail needs time to write logs to S3
- Check CloudTrail S3 bucket:
- Go to S3 console
- Find CloudTrail bucket (name like
aws-cloudtrail-logs-xxx) - Verify new log files are being created
5.4 Verify Lambda Function Execution
- Go to AWS Lambda console
- Select function PrivilegeAnalyticsEngine
- Click Monitor tab
- Check Invocations graph - should show activity
- Click View CloudWatch logs
- Select the latest log stream
- Verify logs like:
Privilege Analytics Engine Started
Processed X privilege events
5.5 Verify DynamoDB Records
- Go to Amazon DynamoDB console
- Click Tables in sidebar
- Select table RiskAssessments
- Click Explore table items
- Verify new records with:
- AssessmentType: ‘Privilege Analysis’
- EventName: ‘AttachUserPolicy’, ‘DetachUserPolicy’, ‘CreateRole’
- RiskScore: Value from 1-10
- EventTime: Recent timestamp
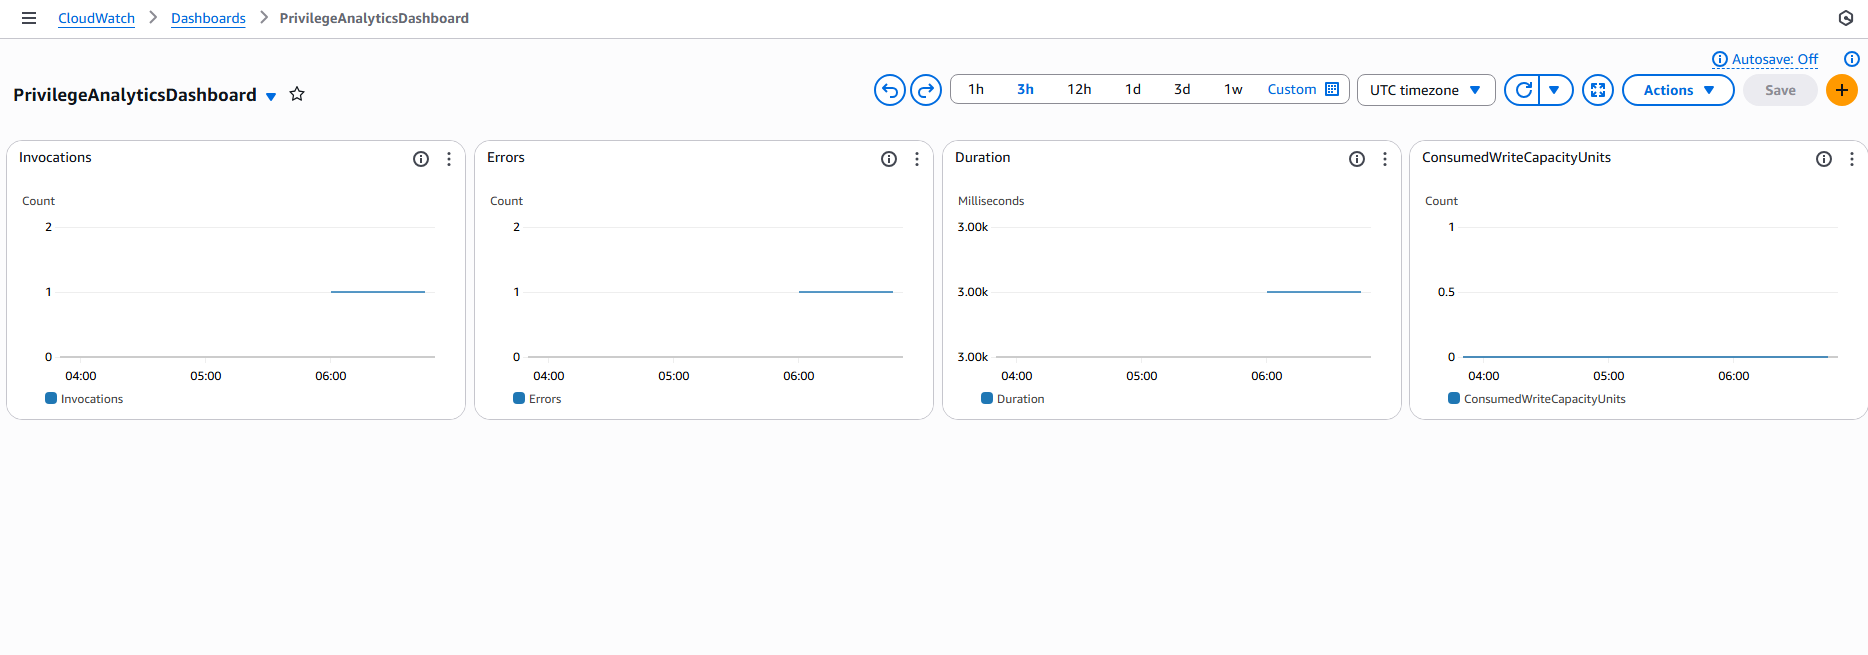
5.6 Check CloudWatch Dashboard
- Go to CloudWatch console
- Click Dashboards
- Select PrivilegeAnalyticsDashboard
- Verify widgets display data:
- Lambda Invocations: Should show spike when function runs
- Lambda Errors: Should be 0
- Lambda Duration: Execution time
- DynamoDB Write Activity: Should show activity when writing data
5.7 Test Real-time Monitoring
- Perform additional privilege action:
- Create new user:
test-user-2 - Attach policy IAMReadOnlyAccess
- Create new user:
- Wait 5-10 minutes
- Refresh DynamoDB table to see new record
- Check if dashboard updates metrics
5.8 Troubleshooting (if no data)
If Lambda doesn’t run:
- Check S3 trigger is configured correctly
- Verify CloudTrail is creating log files in S3
- Check IAM permissions of Lambda role
If no data in DynamoDB:
- Check CloudWatch logs of Lambda function
- Verify table name in code: ‘RiskAssessments’
- Confirm Lambda has write permissions to DynamoDB
If Dashboard doesn’t show data:
- Wait 5-15 minutes for metrics to appear
- Check metric names and dimensions are correct
- Refresh dashboard page
Expected Results
After completion:
- ✅ CloudTrail logs are automatically analyzed
- ✅ Lambda function processes privilege events
- ✅ Risk scoring for privilege actions
- ✅ DynamoDB stores analysis results
- ✅ CloudWatch dashboard monitoring
- ✅ Real-time privilege monitoring
Next Steps
Proceed to 6. Risk Assessment to set up comprehensive risk assessment.